CTO Board
Deck Template
- Driving business results
- Predictable
- Effective $ Efficient
- Unlocking the full value of AI
engineering health update
- {{ error }}
Your request was successfully sent. We'll get back to you shortly.
Credibility risk under Board pressure
CTOs often face challenges in communicating Operational Excellence and connecting it to overall Business Goals. The reasons for that include:
-
 Traditional metrics and trailing indicators such as the number of features, story points, pull requests, or bugs found are difficult to translate into business value.
-
The business and Engineering teams don’t share a common language, leading to important information getting lost in translation .
-
The Engineering team is not being appreciated enough.
-
CTOs are being asked to explain — clearly and credibly — whether AI has made engineering more efficient..
Board-ready clarity - Evidence over anecdotes
The CTO Board Deck Template is a comprehensive guide designed to help CTOs prepare for their next executive check-in with ease and confidence.
- This template focuses on the KPIs and project updates that matter most to business stakeholders, ensuring that CTOs can effectively communicate their team's contributions to the company's success.
- It emphasizes leading indicators that monitor the capability of the process, such as predictability, efficiency, rework, and developer happiness.
- This allows CTOs to replace anecdotes and proxy metrics with a defensible efficiency narrative about what AI changed — and what it didn’t.
The Engineering Metrics Leaders Need
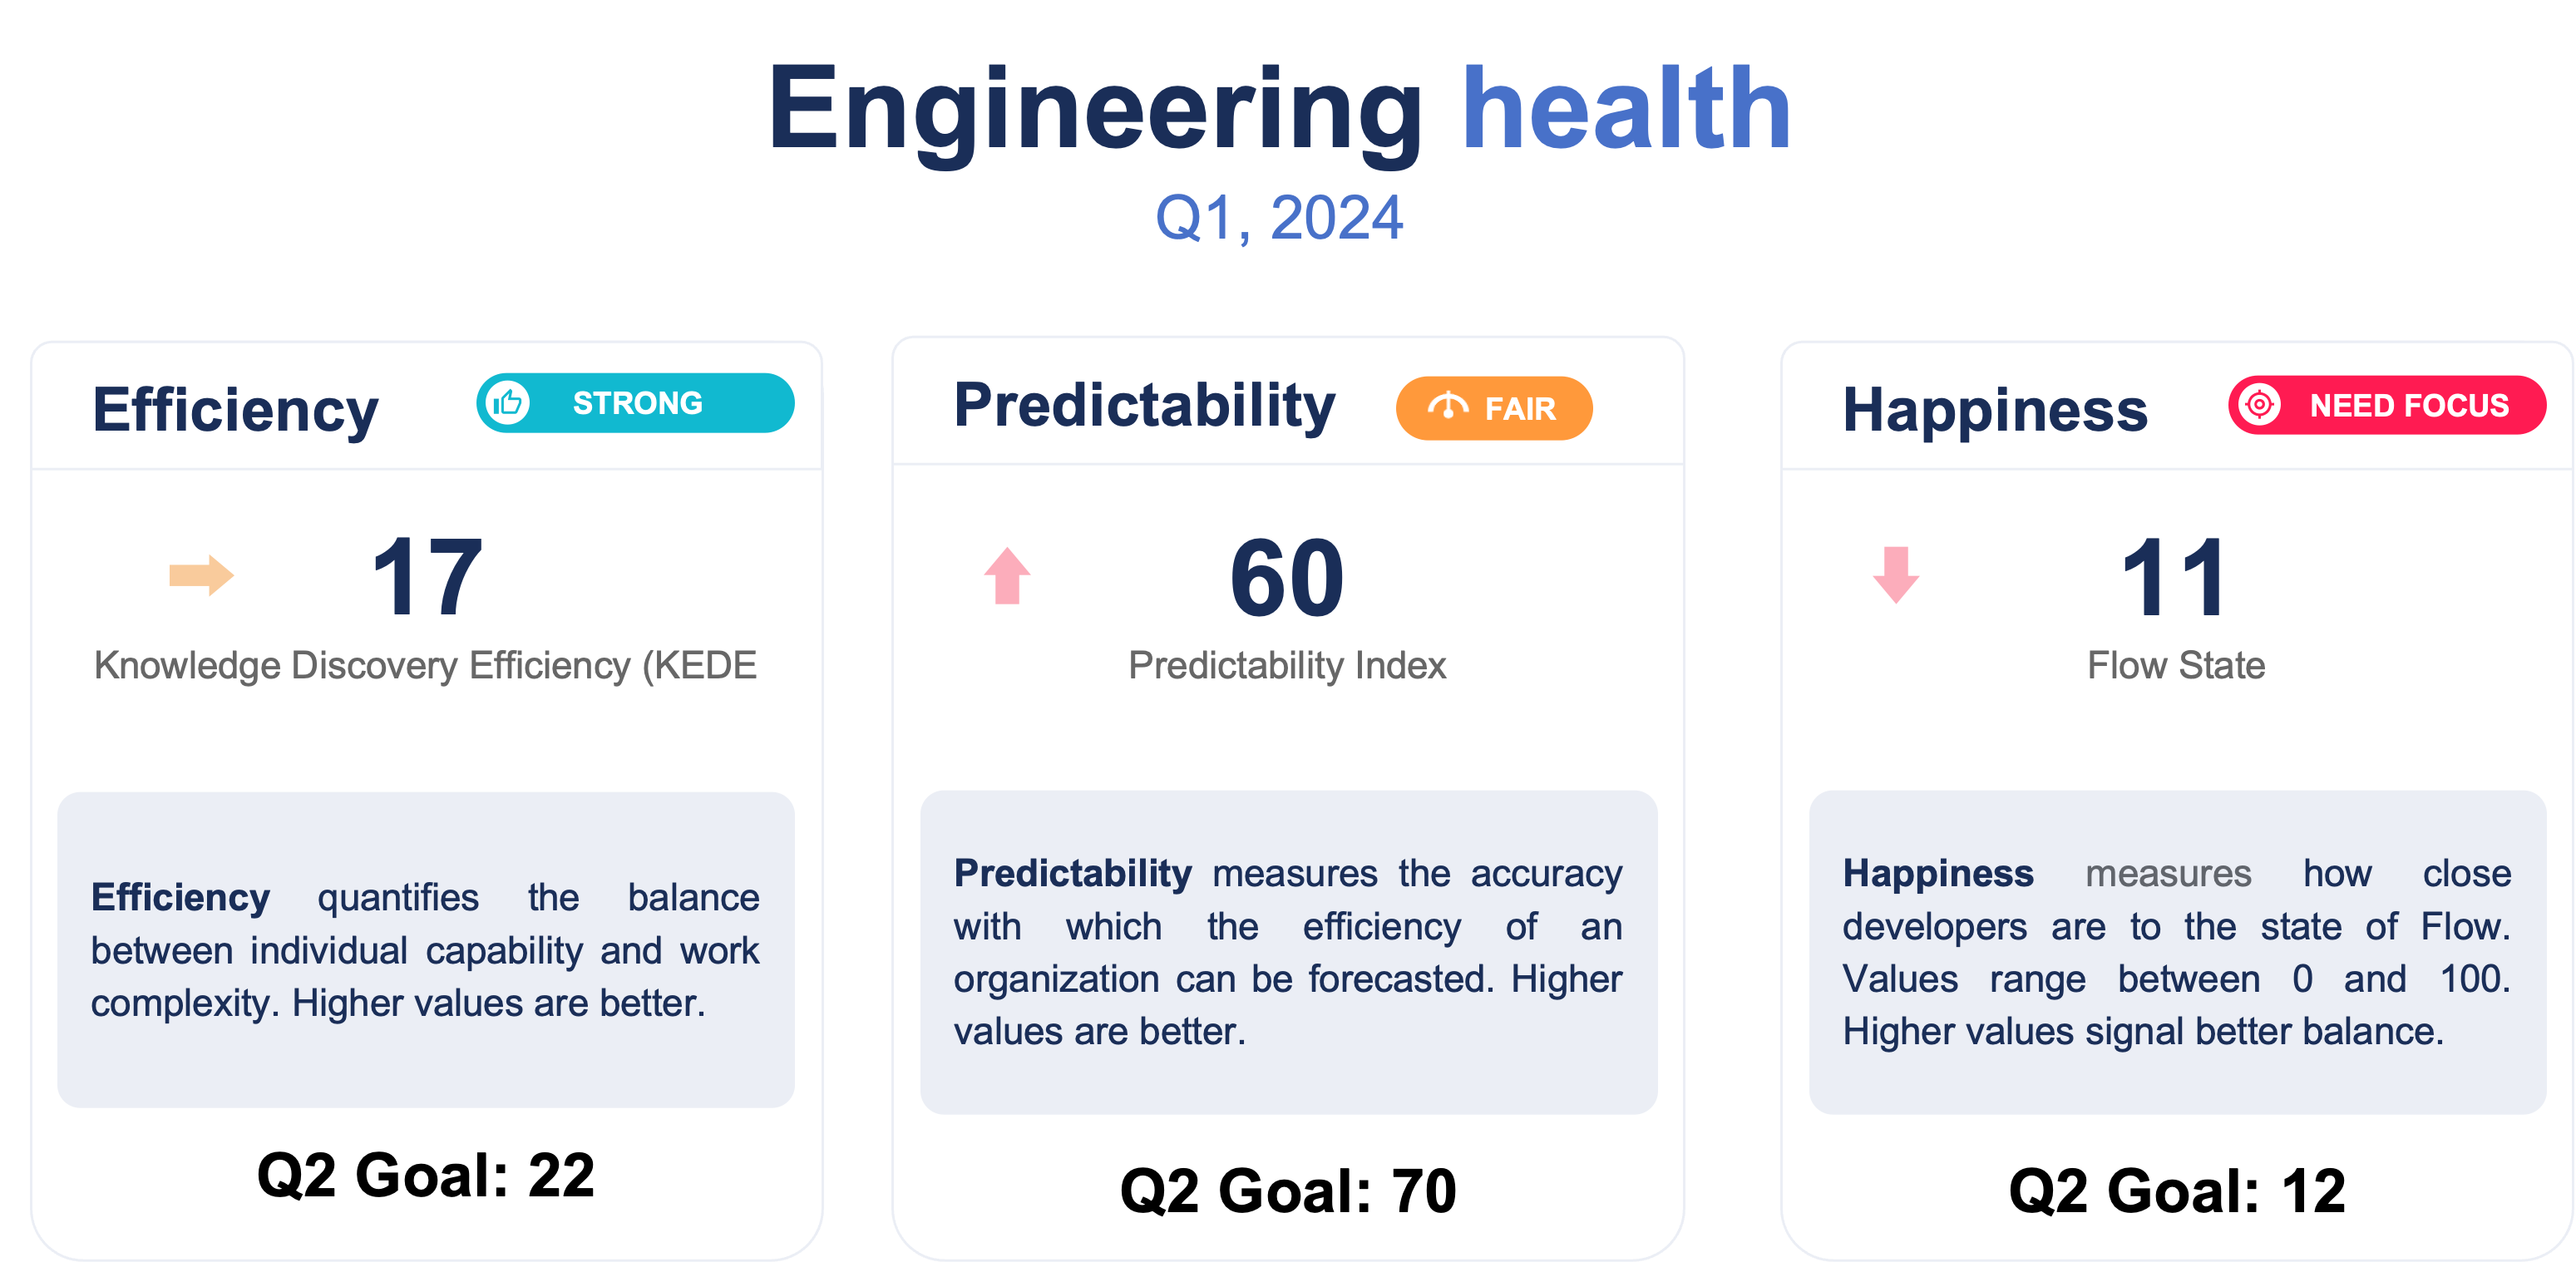
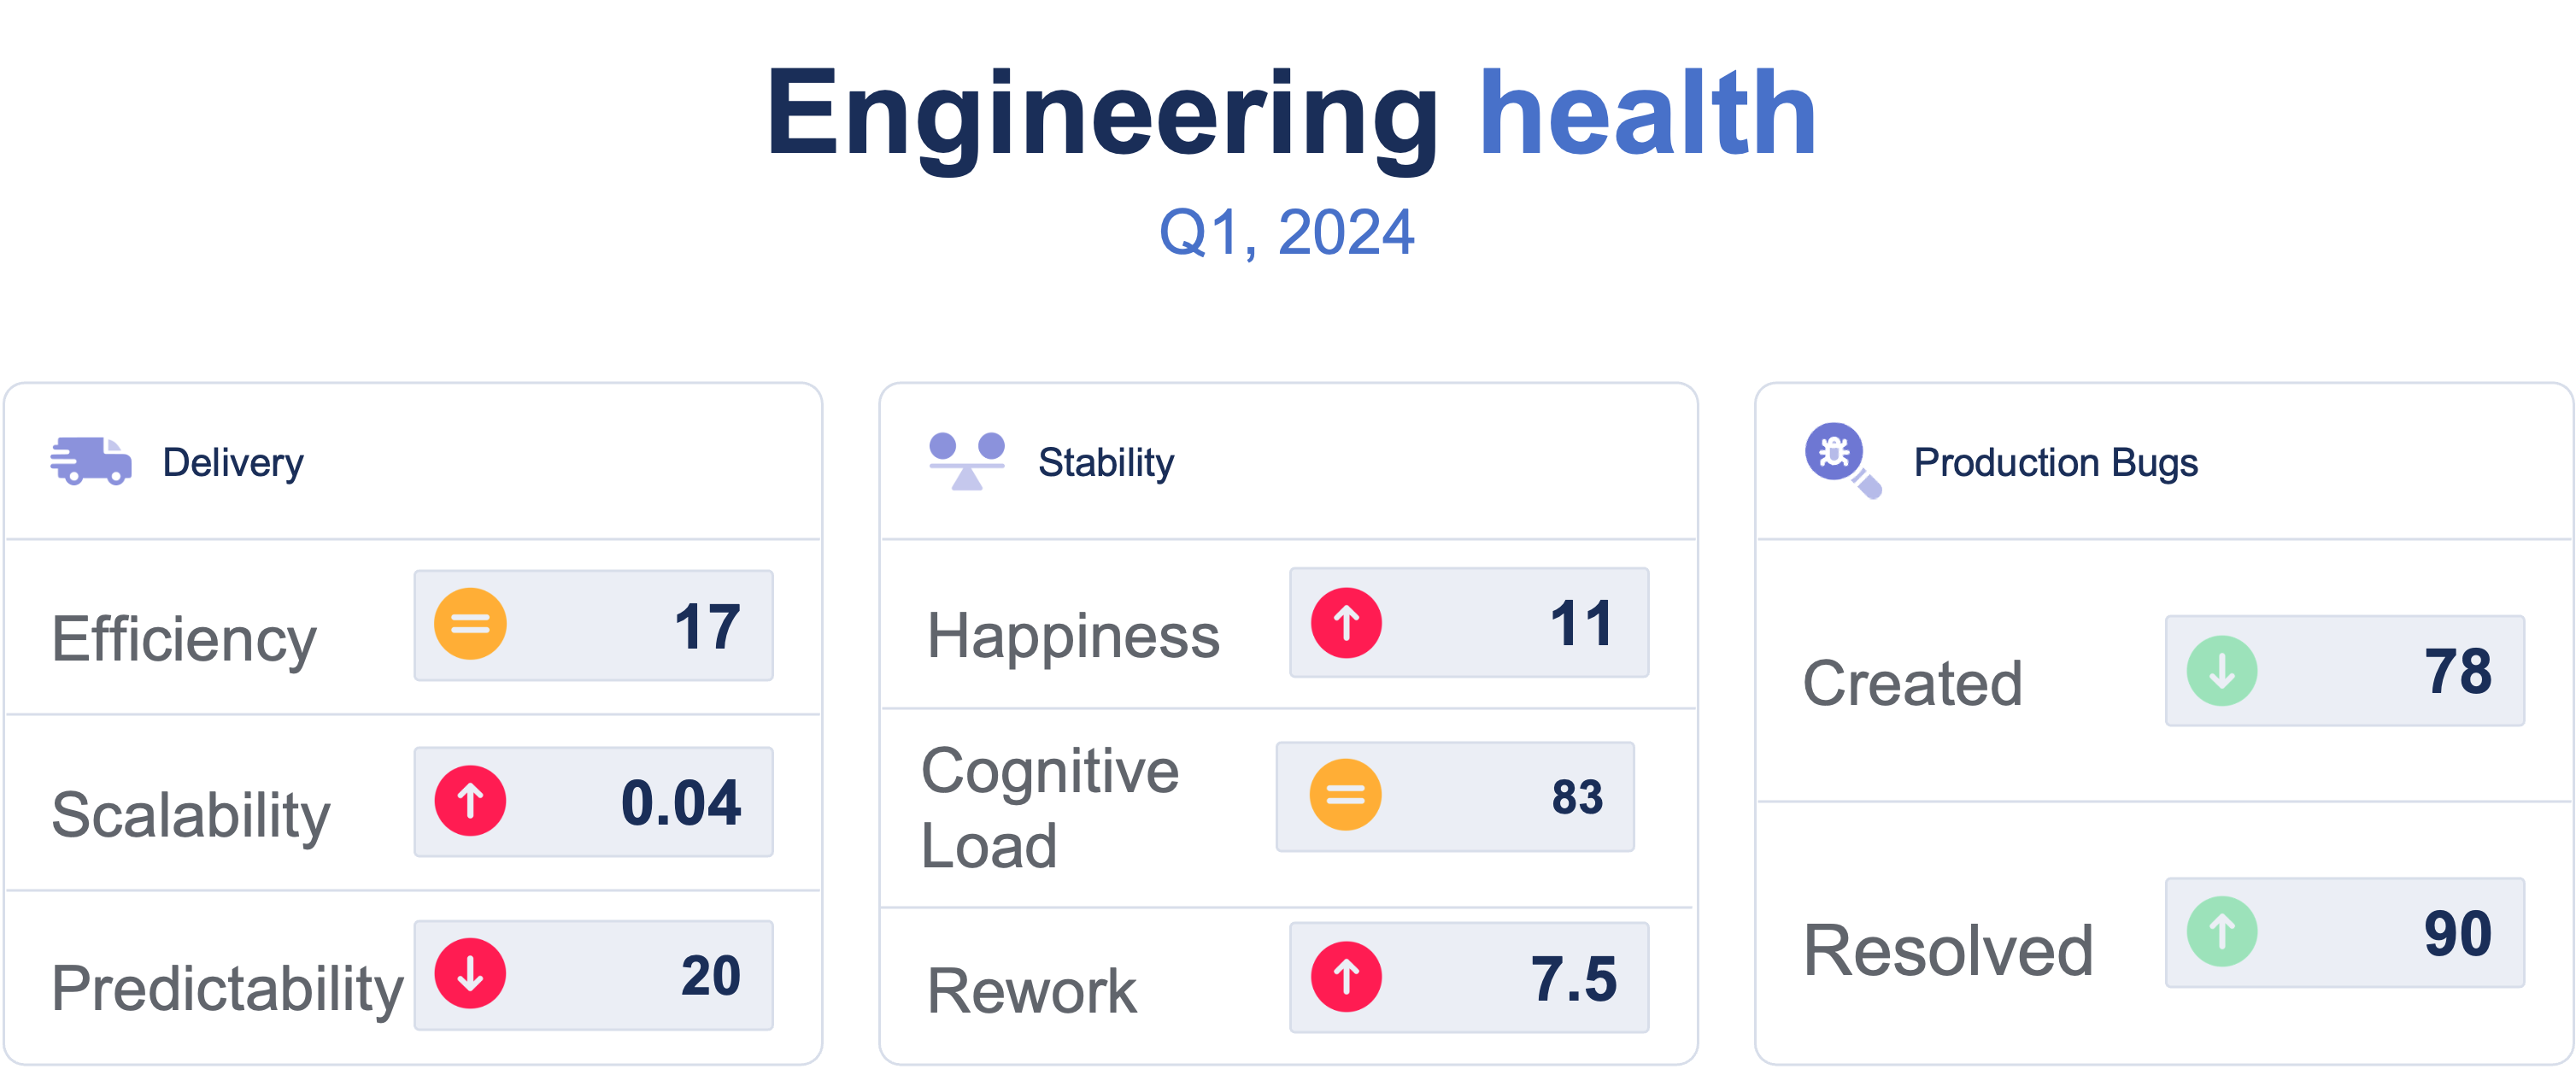
Engineering Health Overview
Begin with a robust set of engineering health metrics to provide a snapshot of your team's overall efficiency. This section should include insights on:
- Efficiency
- Predictability
- Developer Happiness
When presenting this information, incorporate any quarterly goals that have been set, and detail how your teams' performance aligns with these targets.
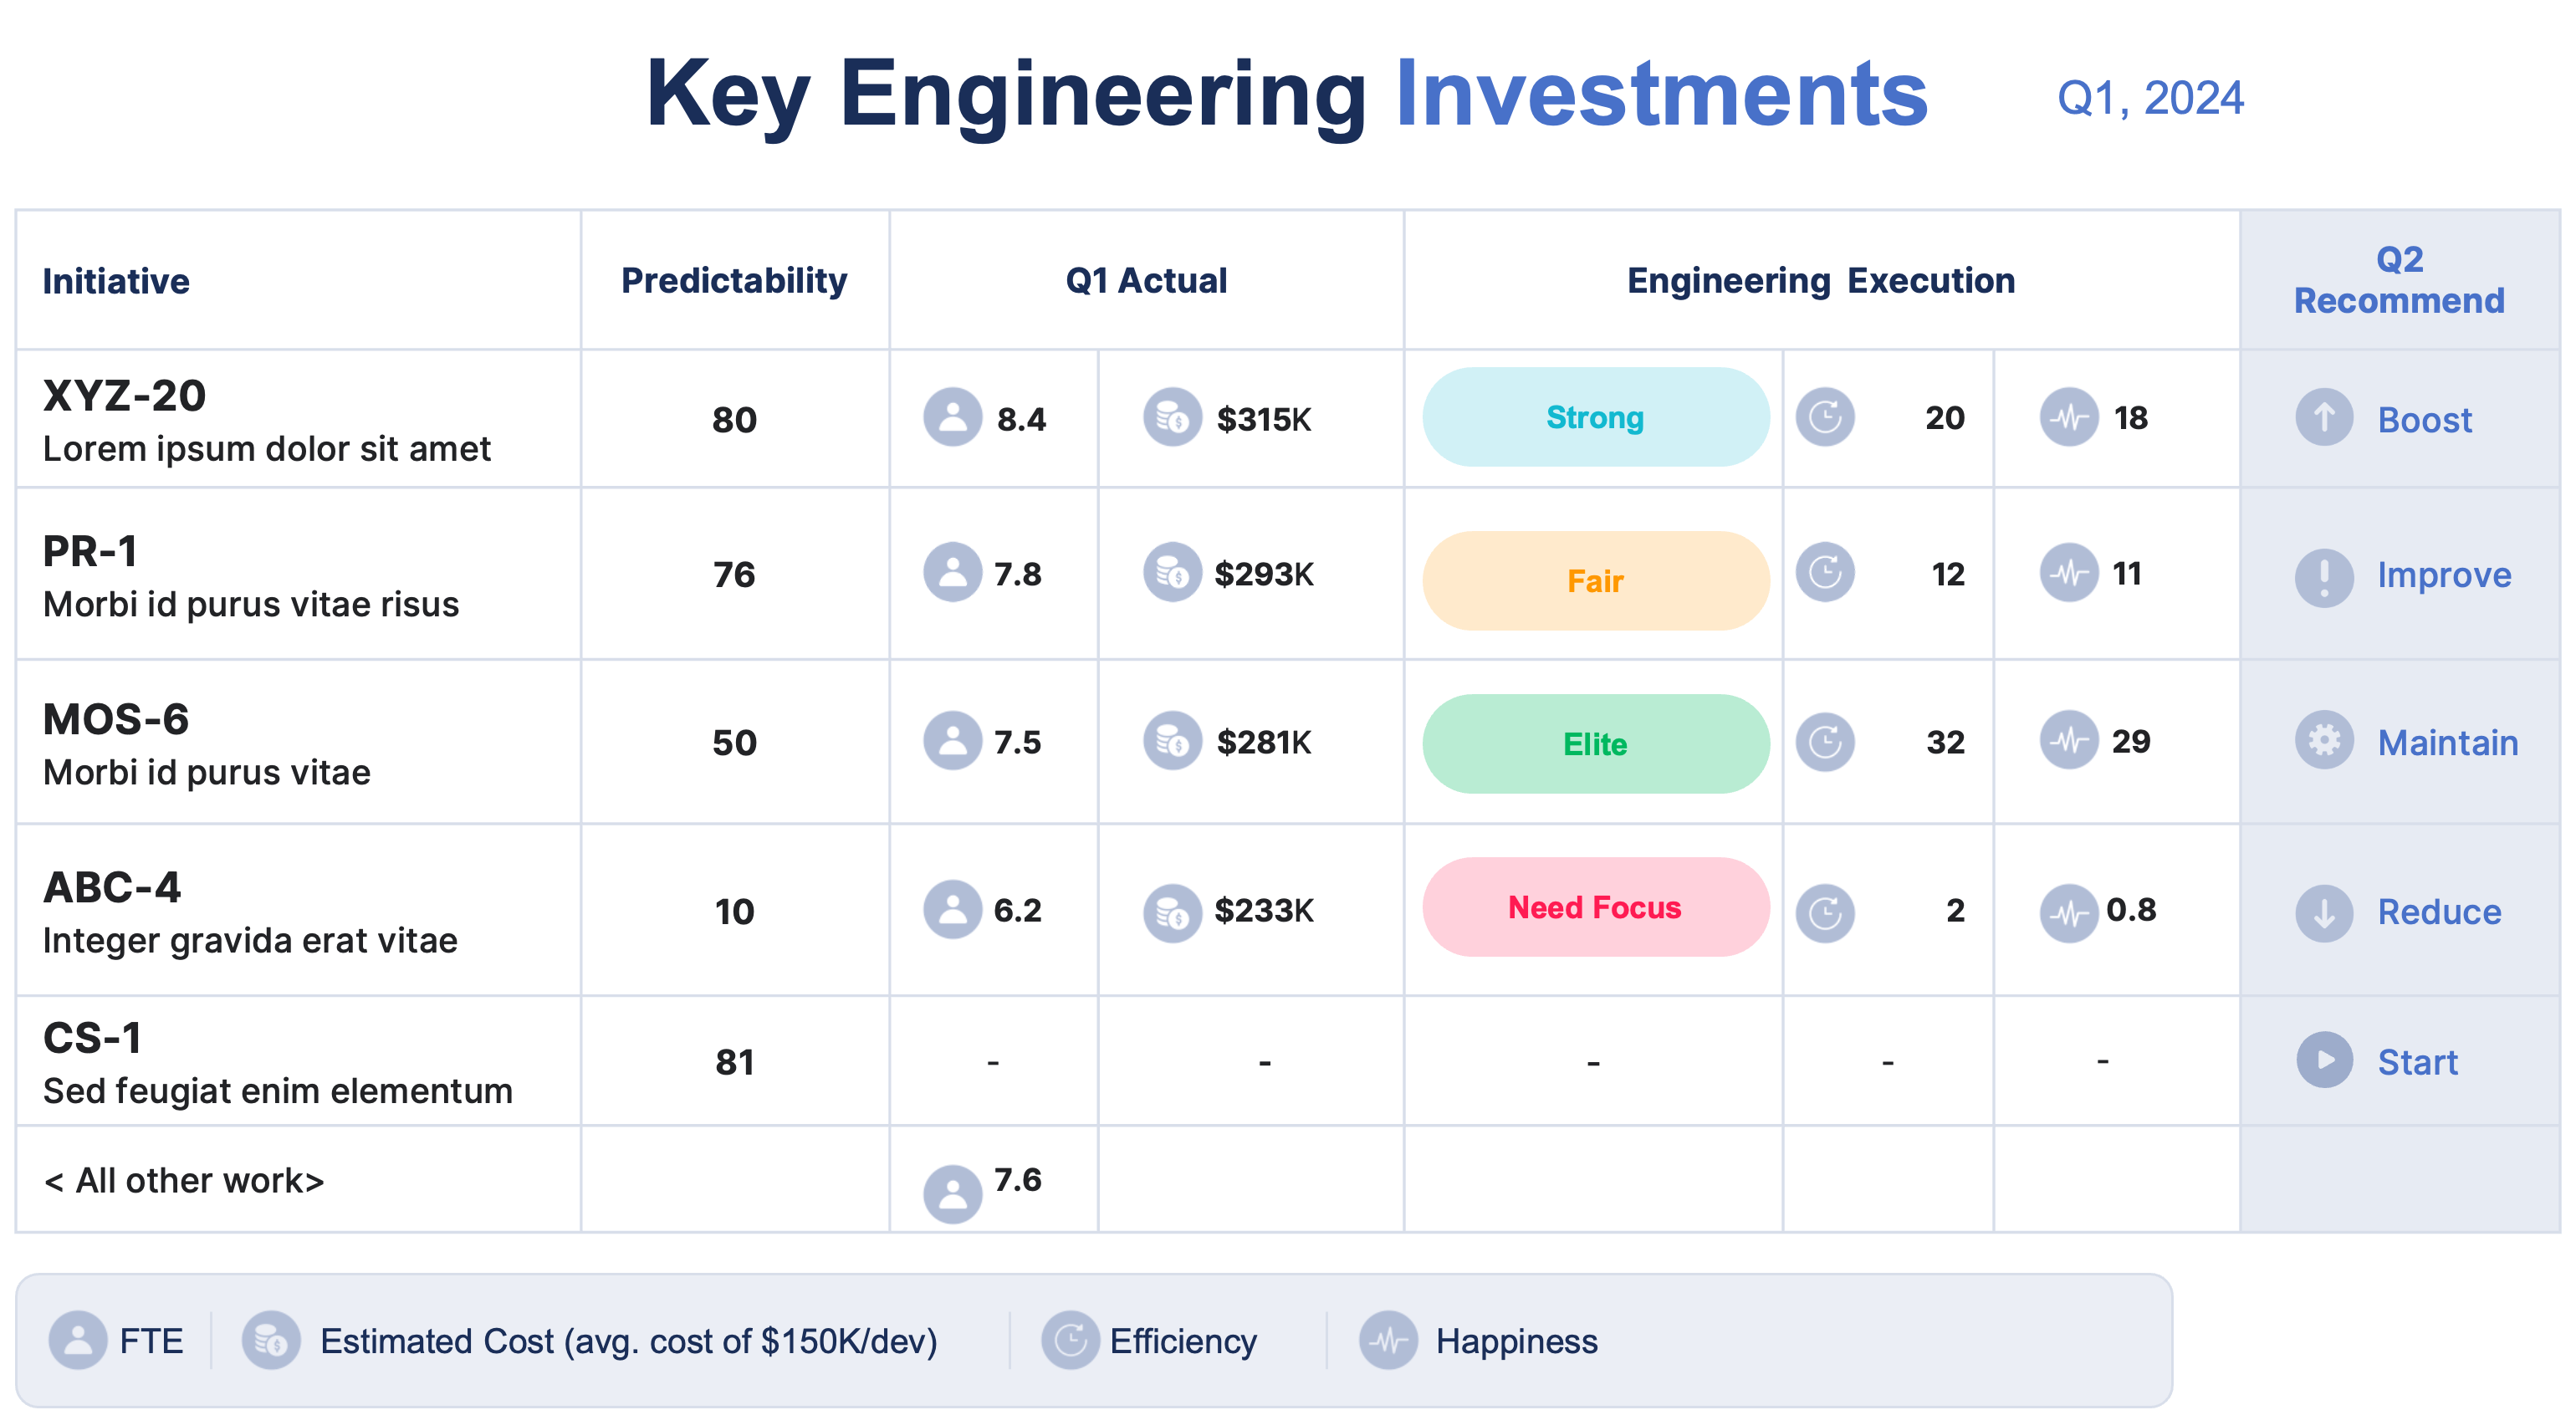
Engineering Effectiveness & Efficiency Tracker
This visual presentation is crafted to succinctly convey key data points and trends, enabling quick insights and decisions. It's an integral part of your board presentation, particularly resonant with business leaders.
You'll highlight the quarter's key initiatives and projects, and outline your strategic recommendations for the upcoming quarter in terms of:
- Predictability
- Defect Escape Rate (DER)
- Effectiveness metrics
- Process Quality metrics
- Your prescribed guidance on how to move forward with these projects
These metrics serve as leading indicators of engineering performance for the quarter.
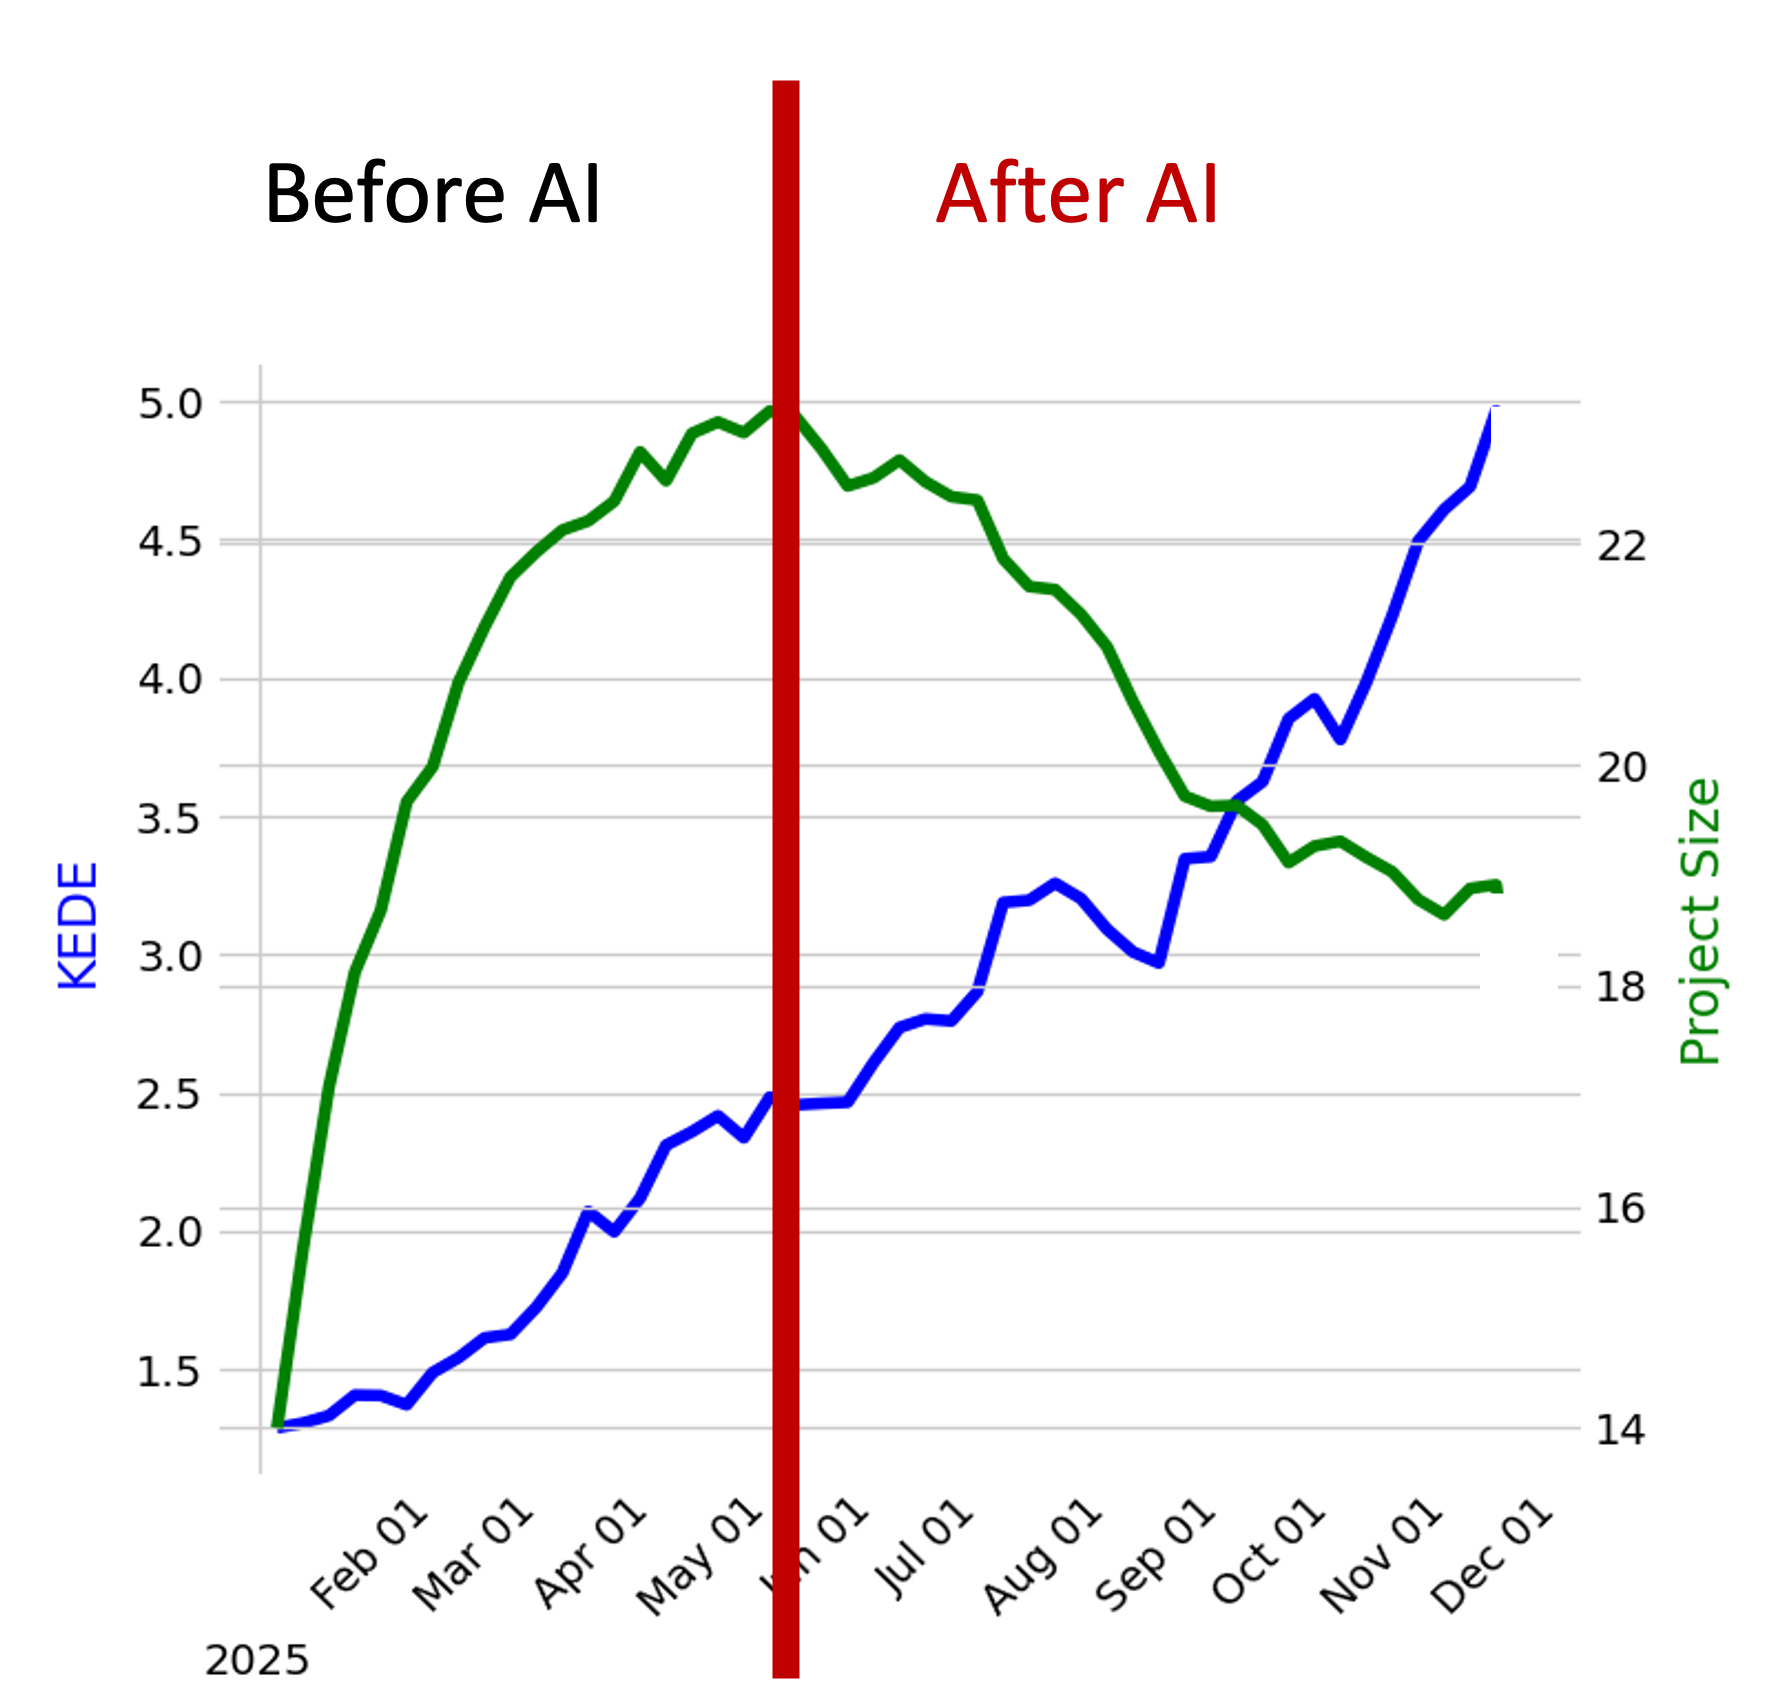
AI Impact on Efficiency
After covering overall engineering health and resource allocation, delve into how engineering efficiency has evolved over time. Focus on what AI changed — and what it didn’t:
- Developer Happiness
- Efficiency
- Rework
Replace anecdotes and proxy metrics with a defensible evidence that shifts AI conversations from tools to efficiency economics. Answer questions with a concise narrative that resonates with the entire leadership team
Preparing with additional data
Anticipate further questions by preparing a series of index slides.
Examples for deeper dives might include:
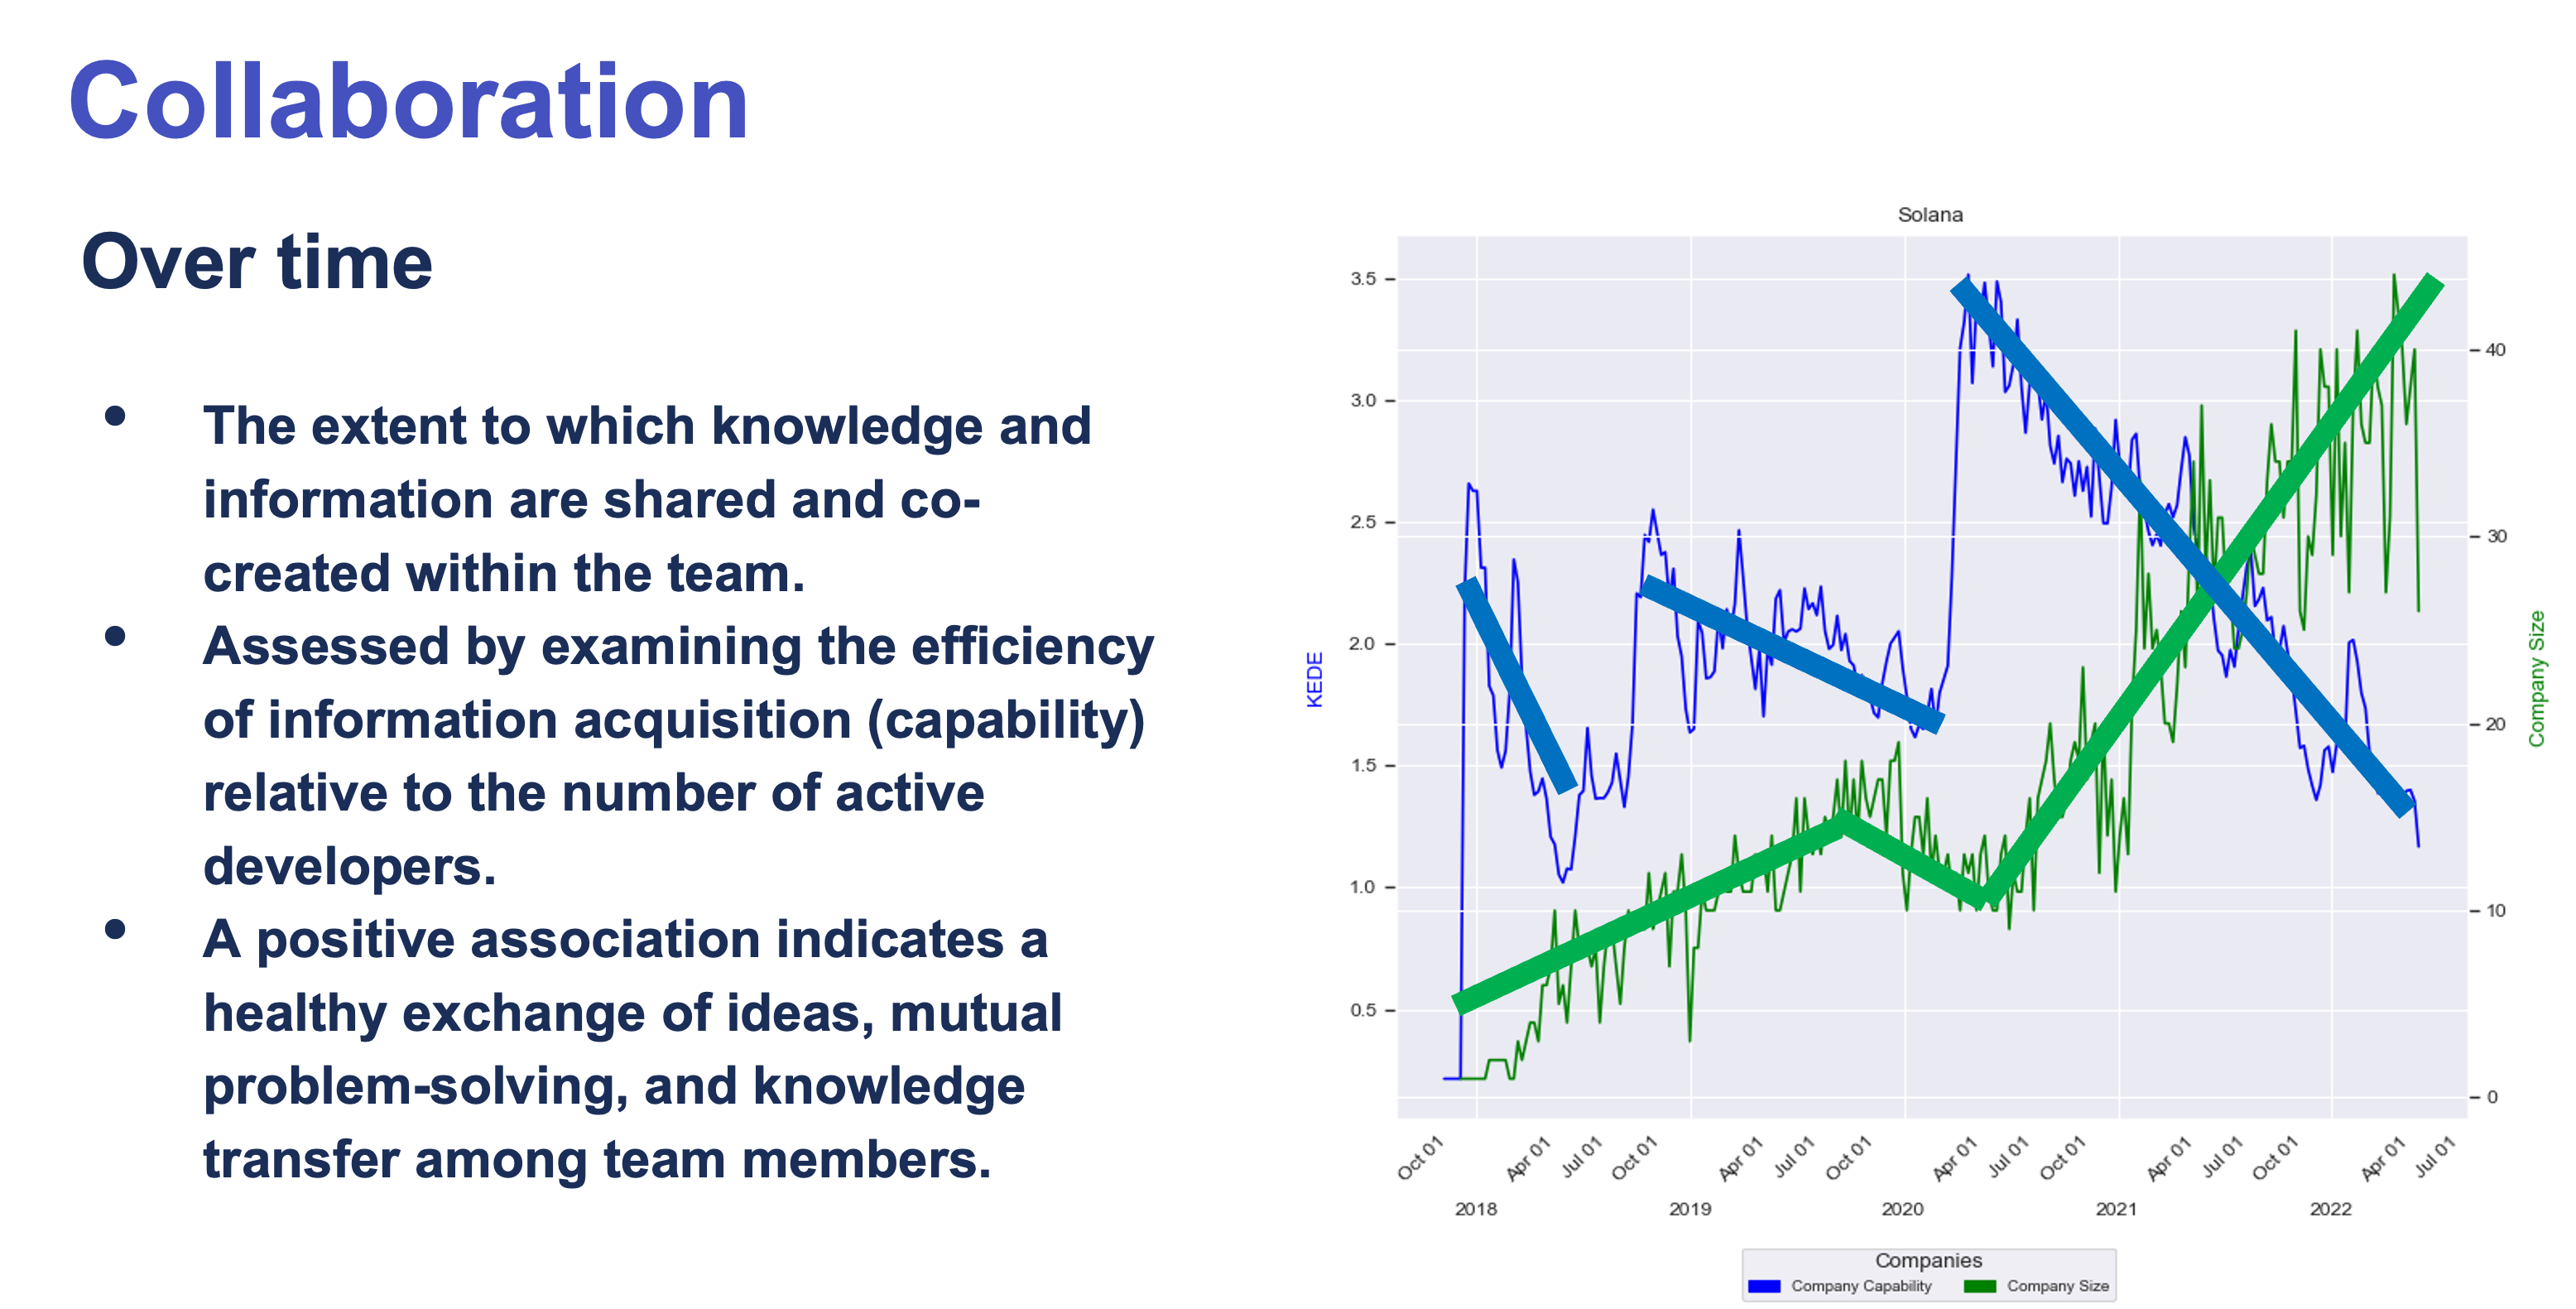
- Collaboration
- Cognitive Load
- Scalability
- Productivity
These topics can provide additional depth and are detailed in the CTO Board Slides index section for further inspiration.
KPIs and Efficiency Metrics Deep Dive
After covering overall engineering health and resource allocation, delve into core engineering metrics such as stability and delivery metrics, along with overall quality. Focus on:
- Whether your teams realize their full potential
- How predictable is the performance of your teams
- Whether your developers enjoy their work experience
Include data on trends observed during the current quarter, enhancements from previous quarters, and projections for future periods.
Getting started


